Wednesday, February 6, 2013

Windy [UPDATED 12 Feb.]


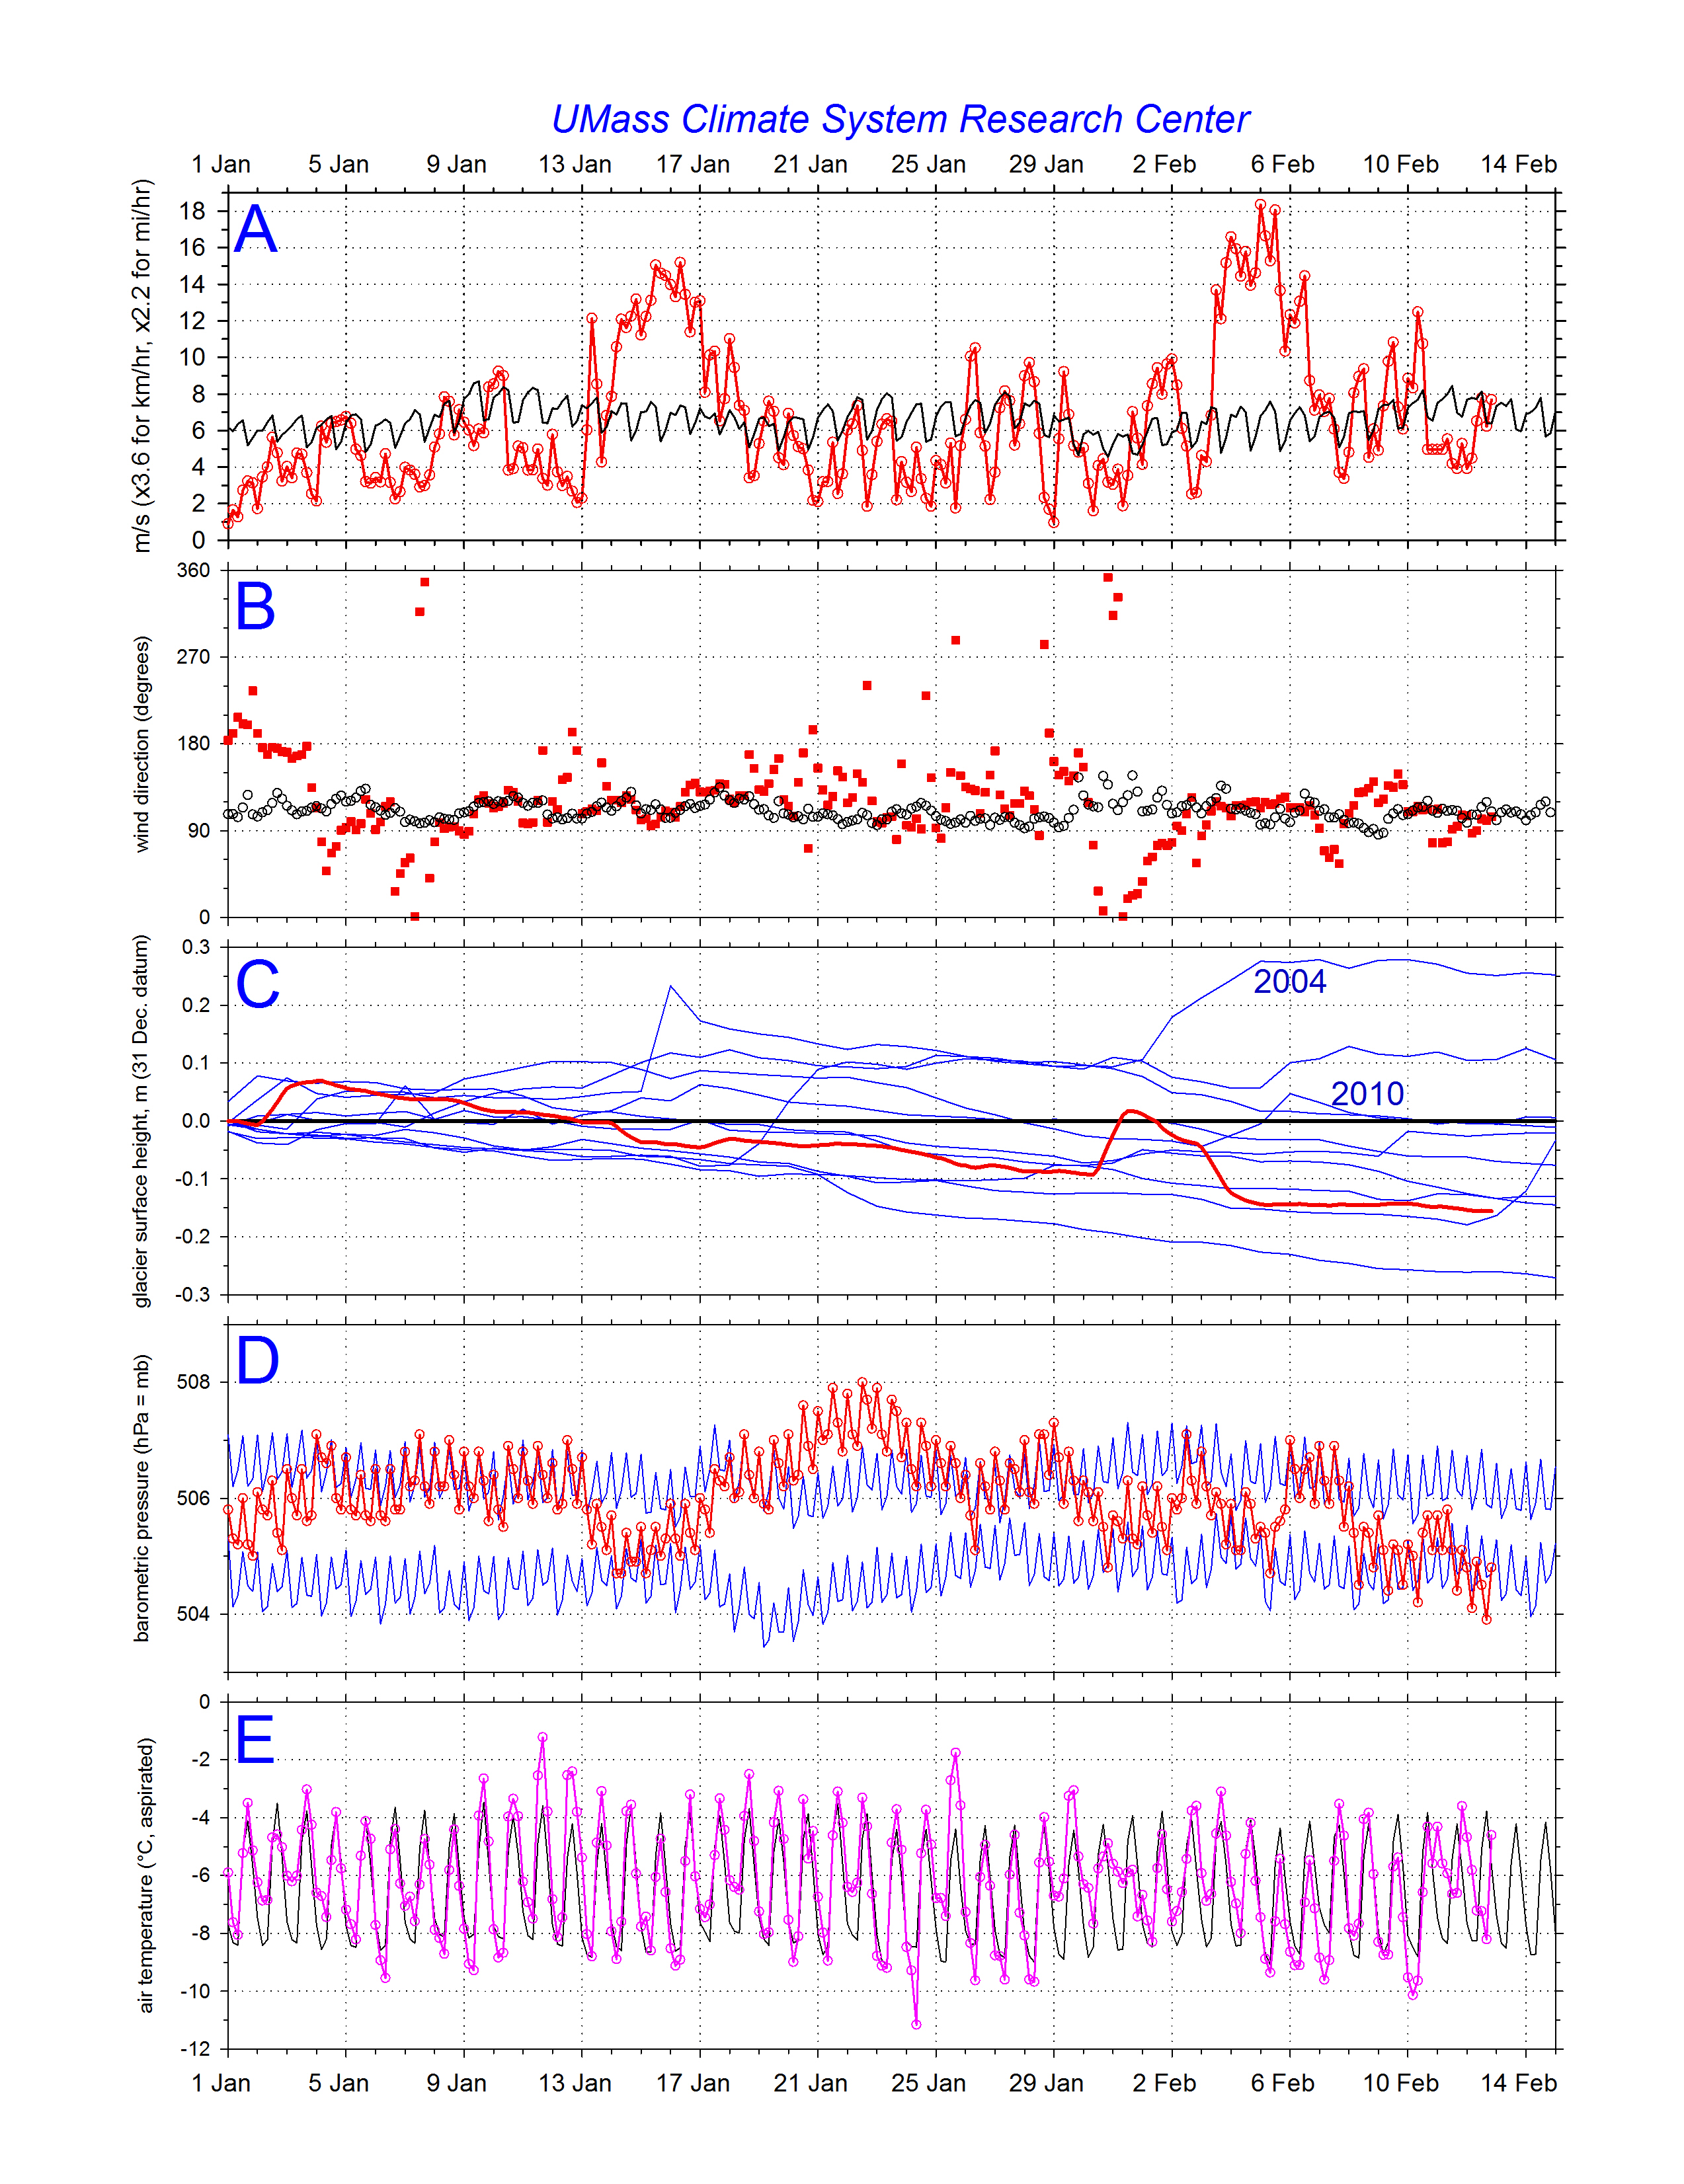
[UPDATE 12 Feb. 18:00 GMT] A final update to the weather graphic has been posted below (or here). Wind speeds and direction have returned to more typical, seasonal values. It was ironically the interval 3-6 February with anomalously high wind speeds, while the expedition was at the summit and prepared to fly off. Was early February a good time of year for the flight? Certainly; the longterm mean values shown in plots A and B both demonstrate that - on average - conditions at the summit at this time are very reasonable for paragliding. But, as we have learned in our decade of measurements, the interannual variability of climate on Kilimanjaro is large -- and summit weather can never be taken for granted.

[UPDATE 7 Feb. 04:00 GMT] Telemetry data from the summit as of midnight Wednesday local time have been added to the graphic below. Late yesterday the wind speed dropped, and Thursday is beginning with winds steadily from the East at a more reasonable speed of 8 m/s. However, humidity was high through the day Wednesday and approaching saturation at midnight. Note how little snow ablation occured (plot C). Looking forward, the forecasting models show a strong gradient in 500 hPa-level humidity parallel to the Tanzania-Kenya border, so exactly how the pattern becomes established may determine if tomorrow (Thursday) is flyable. Lets hope for the best.

Previously:  at 9 AM Tuesday morning, the image above shows how Kibo appeared from Moshi (courtesy my friend Simon at Summit Expeditions:  website and FaceBook). Such great clarity is the result of strong easterly wind. Very strong. Too strong for paragliding.

Check the graphic below to see a context for wind speeds since Sunday; plotted values have been updated to 8 AM local time this morning. In quantitative terms, the 4-hourly wind speed for the period 20:00 - 24:00 last night was 18.4 m/s = 36 knots = 41 mi/hr = 66 km/hr. This is more than 2 standard deviations greater than the longterm mean for this time and date, and as discussed in the 1 Feb. entry below, wind speeds over shorter intervals (e.g., 1-min average) have almost certainly been much greater. Furthermore, this 4-hourly speed equals the highest 4-hourly February value we have recorded on the glacier, which occurred 8 February 2004 (8 AM to 12 PM).

The forecast does indicate lessening wind speed, although it may be another day or two. To clarify yesterday's post concerning wind speed decreasing through the morning, this is the generalized diurnal pattern on Kilimanjaro, not a forecast. Nonetheless, the NOAA Climate Prediction Center forecast for the Kibo grid cell shows decreasing wind speeds at 500 hPa in the hours ahead. Lets hope so, for those seeking to fly down.

Lastly, this nice image from Moshi clearly shows the glacier changes mentioned in the previous post. Ice extent today is quite different from that of 10 years ago shown on the Wings of Kilimanjaro FlyTrace map.

Monday, February 4, 2013

Summit weather - Monday


The graph page below reflects summit weather measurements to 04:00 local time today (East Africa); accompanying text update is in this post, rather than previous.

The Wings of Kilimanjaro group reached Crater Camp today, where they are spending the night. Their location can be seen on the FlyTrace map showing positions for many of the pilots. Note that the background image visible when "satellite" is clicked (upper right-hand corner) was acquired on 31 January 2003, so is almost exactly 10 years old. The glaciers are considerably reduced in area and volume since then, as discussed elsewhere on this blog and on this website.

Summit weather today probably provided a good indication of what conditions will be like tomorrow for the launch. Winds at the weather station have been moderately strong, yet appear to be steadily from the East. According to the NOAA NCEP GFS forecast for summit level (500 hPa), winds tomorrow will remain from the same direction, and perhaps decrease somewhat in speed. Based on our climatology and the GFS forecast, wind speed will likely decrease through the morning at summit level.

Humidity has been low since about dawn on 1 February, and continues to be low today (i.e., below 15 percent). Combined with moderate wind speeds, considerable snow sublimation appears to have taken place recently (see graph D below), and snow cover has likely decreased steadily over the past few days.

Measurements shown below suggest that tomorrow, 5 February, may be favorable weather for flying off the summit! The collective experience of the summit and landing-zone groups will have to assess all factors - some of which are not apparent looking at the situation remotely - before making a final decision. But their wealth of experience will serve them well. Best wishes to all for an amazing flight down!

Friday, February 1, 2013

Wings Weather [graphic UPDATED 12 Feb.]

[click graphic to open in a new window, or here for a PDF

The Wings of Kilimanjaro expedition reached Barranco Camp today (1 February), right on schedule. Their FaceBook page mentions seeing fresh snow at the summit as they traveled from Moir Camp to Barranco via Lava Tower (see graph above and discussion below). The group of 68 pilots, 16 passengers, 11 crew and 600 porters are climbing up for a paragliding event from the summit on approximately 5 February. The Tanzanian Government has sanctioned this event, which hopes to raise over USD 1,000,000 for three different East African charities.

Pilots and guides may be interested in a historical context for weather on the mountain, provided here for wind speed & direction, snowfall, pressure, and air temperature over the period 1 January to 15 February. Also shown on each graph are 2013 measurements obtained by satellite telemetry; these will be updated through the interval as time permits. Thanks to Mike Rawlins in the UMass Climate System Research Center for extra effort with data processing.

An article detailing our involvement with Wings of Kilimanjaro has just been published in the Boston Globe, and available here.

Plot A depicts 4-hourly averages of mean horizontal wind speed, in meters per second (m/s). This long averaging period is required by telemetry limitations, and actual wind speeds will ALWAYS be higher; averages shown differ from much-shorter, standard wind speed averaging times (e.g., 1-minute). In black is the average 4-hourly wind speed for the period Feb. 2000 to Sep. 2012. Values are slightly smoothed by a 3-day running average for each time (SD of the mean is ~3 m/s, not shown). Note the diurnal cycle in wind speed, typically with morning maxima. Plotted in red are 4-hourly wind speeds for 2013.

To convert wind speed to km/hr, multiply values shown by 3.6; a multiplier of 2.2 will convert values to mi/hr (MPH).

Plot B illustrates wind direction, with black circles showing mean 4-hourly resultant values (2000-2012), and 2013 4-hourly vectors as red squares. Note how consistent the mean airflow is at this time of year, from just south of East, with greater-than-normal variability lately.

Accumulation (snowfall) and ablation are depicted in Plot C, referenced to 31 December for each year shown. Blue lines show 2002 - 2012 (w/o 2009) and the red line shows 2013. Considerable interannual variability is illustrated. Note that the summit has received very little new snow between 3 and 29 January. We have a report* that on the 29th (Tuesday) it "rained a lot between Shira and Barranco camp" and that "it snowed big time at Crater Camp, Arrow Glacier Camp, and in the Western Breach." According to the AWS, summit snow accumulated for about 24 hours beginning at midday on the 30th. About 11 cm accumulated quickly, a substantial event for the arid summit. [*Thanks to Timba at Ahsante Tours for this.]

Plot D shows barometric pressure, with +/- 1 standard deviation of the mean 4-hourly averages shown in blue, and 2013 4-hourly values shown in red. Note that the semidiurnal pressure oscillation is apparent even in 4-hourly data! Also, pressure between 16:00 on 19 January through the 23rd was higher than measured for any of these 4-hourly intervals since June 2001. The significance of this is not entirely clear, but could reflect an interval of anomalously warm troposphere at altitudes below this level (i.e., increasing geopotential height).

Finally, plot E is air temperature as measured within our aspirated radiation shield, with 2013 values in pink. Note the early-morning minima on the 24th. The relative warmth shown on 29, 30, and 31 January is likely due to cloud cover, as humidity began increasing in the afternoon of the 29th (not shown). 

NB:  All discussion and accompanying figures on this website are for scientific purposes only, to aid in interpreting the climate on Kilimanjaro’s Northern Ice Field. All data are preliminary and not in real-time; measurements may not be representative of conditions at the summit, in the surrounding atmosphere, or elsewhere on the mountain. The author and any institutions with which the author is affiliated assume no responsibility for any application of these interpretations or these data, including but not limited to paragliding and hang-gliding. Be safe!